Smith Chart
Smith Chart
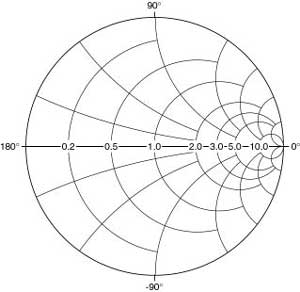
The Smith Chart, created by Phillip Smith, is perhaps the most widely used design tool in the field of microwaves. From the beginning of World War II until the development of digital computers for engineering problems, the Smith Chart was the dominant tool for microwave engineers.
This simplified version of a Smith Chart shows both resistance in ohms (numbers on the horizontal axis that range from 0.2 to 10) and the angle of a quantity called the reflection coefficient, in degrees on the outer edge of the circle.
Many problems in microwave engineering can be likened to an American football game. Just as a football team’s objective is to get the ball to the goal despite the obstructions caused by the opposing team, the microwave engineer’s objective in many instances is to get as much microwave power as possible through electrical obstacles on its way to the goal of being transmitted from an antenna or being amplified in a receiver. Football coaches use charts with special symbols to plan plays, and the Smith Chart is a kind of engineers’ play chart for microwaves.
Smith originally designed his chart to solve problems he encountered in transmitting radio waves along a special type of cable called a transmission line that conducts the waves from a radio transmitter to an antenna. Ideally, all the waves would go smoothly along the line in one direction and no reflections would occur. However, with many types of antennas, some of the waves are reflected back into the line. These reflected waves can bounce back and forth along the line and are eventually lost, reducing the amount of power transmitted.
Smith tried to graph the effects of these reflections on an early type of rectangular chart developed by J. A. Fleming for telephone lines, but he kept getting numbers that went off the top and bottom of the chart. In 1936, he had the idea of using a circular chart and transforming the reflections mathematically so that no matter how large they were, the numbers would all fit inside the circular boundary of the chart. For this and other reasons, Smith’s new circular chart made many microwave engineering problems in both circuits and transmission lines easy to solve graphically (that is, without doing a lot of math). In the days before electronic digital computers, any technique that allowed an engineer to avoid tedious calculations was very valuable, so Smith’s chart became popular among radio and microwave engineers within a few years after its publication in Electronics magazine in January of 1939.
In the 1970s Smith formed a company, Analog Instruments, which merchandised navigational instruments for light aircraft and later supplied Smith Charts and chart-related items. By 1975 he had sold about 9 million copies of his chart to microwave engineers all over the world. Even though computers are now the dominant design tools, the Smith Chart remains vital to the field of microwaves. Its usefulness continues to this day as a method of displaying measured and calculated data produced by computer software and modern measurement instruments.
